
Student Data Viz Gallery
Student Data Viz Gallery
Voting Process
Below is the Faculty/Staff Data Viz Gallery. Members of the Big Ten Academic Alliance community are invited to vote for the winner Data Viz Challenge. Voting will be open through noon on February 16, 2024. The visualization with the most votes will win the Challenge. Individuals can vote only once and have to be members of a Big Ten Institution.
Each entrant will be invited to present their work at the Data Viz Showcase on February 16 at 1 p.m. CT/2 p.m. ET. At the end of the showcase the results of the voting will be announced, and the Challenge Winners crowned.
For more information, contact info@btaa.org or your Institutional Coordinator.
Student Data Viz Gallery
Note: Many of these visualizations use Tableau Public, a service which will be down for maintenance on the afternoon of Saturday, February 10.
Lego Rarity and Frequency Dashboard
.webp?sfvrsn=d0e423d9_1)
LEGO Most Popular Themes
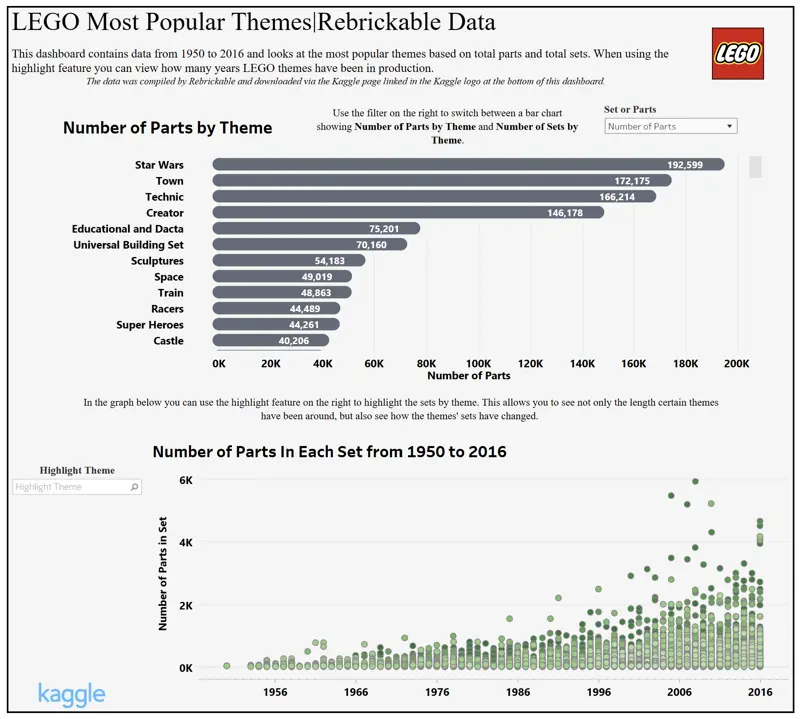
Description: Since the 1950's LEGO has created thousands of different LEGO sets all of which are assigned to a specific theme. Some themes are based on movies like Star Wars, while others are based on cities or cars. A simple question to ask is, which LEGO theme is most popular? The answer, however, is not as simple. In my dashboard you can decide which theme you believe is most popular by looking at three different metrics: number of sets for each theme, number of parts for each theme, and length the theme has been around.
Author: JT Underhill - Indiana University
Lego, by the Numbers
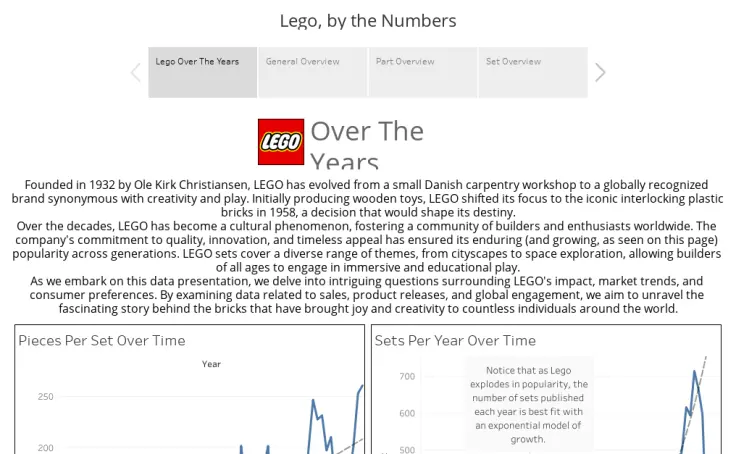
Description: This dashboard gives general metrics to allow users to visualize Lego's historical development in complexity and style, and then cycle through individual breakdowns by part or set to analyze components and trends for specific points of interest.
Author: Walter Osborne - University of Maryland
The World of Lego
Description: Uncover trends in set design and part variety over the years.
Author: Robert Butts, Ohio State University
70 Years of Lego Sets
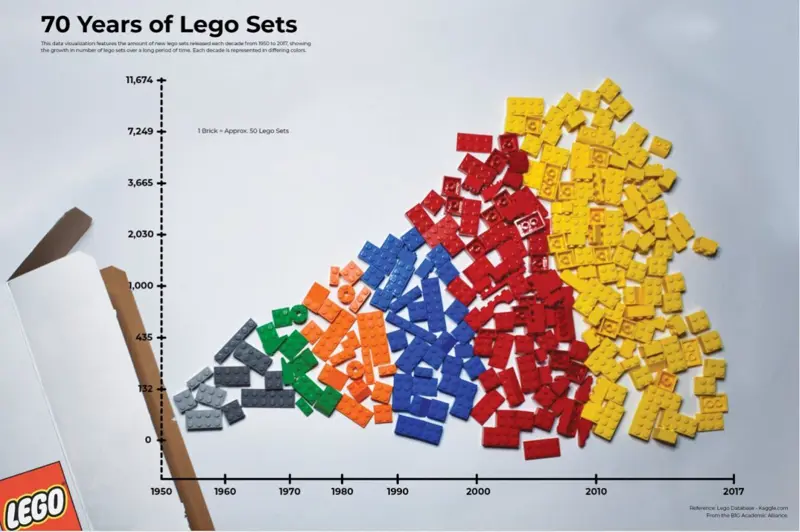
Description: This data visualization features the amount of new Lego sets released each decade from 1950 to 2017, showing the growth in number of Lego sets over a long period of time. Each decade is represented in differing colors.
Author: Jonathan Petersen - Penn State University
Love Lego Universe
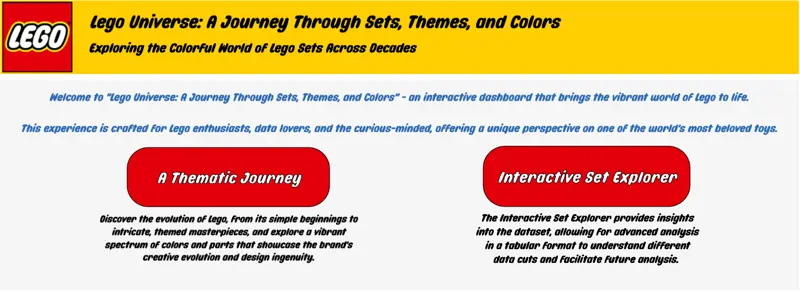
Description: Lego Universe: A Journey Through Sets, Themes, and Colors. Explore the colorful world of Lego sets across decades in an interactive dashboard that brings the vibrant world of Lego to life. This experience is crafted for Lego enthusiasts, data lovers, and the curious-minded, offering a unique perspective on one of the world's most beloved toys.
Authors: Siddhant Treasure and Shivam Mishra - Purdue University
Evolution of Lego Set Complexity Over Time
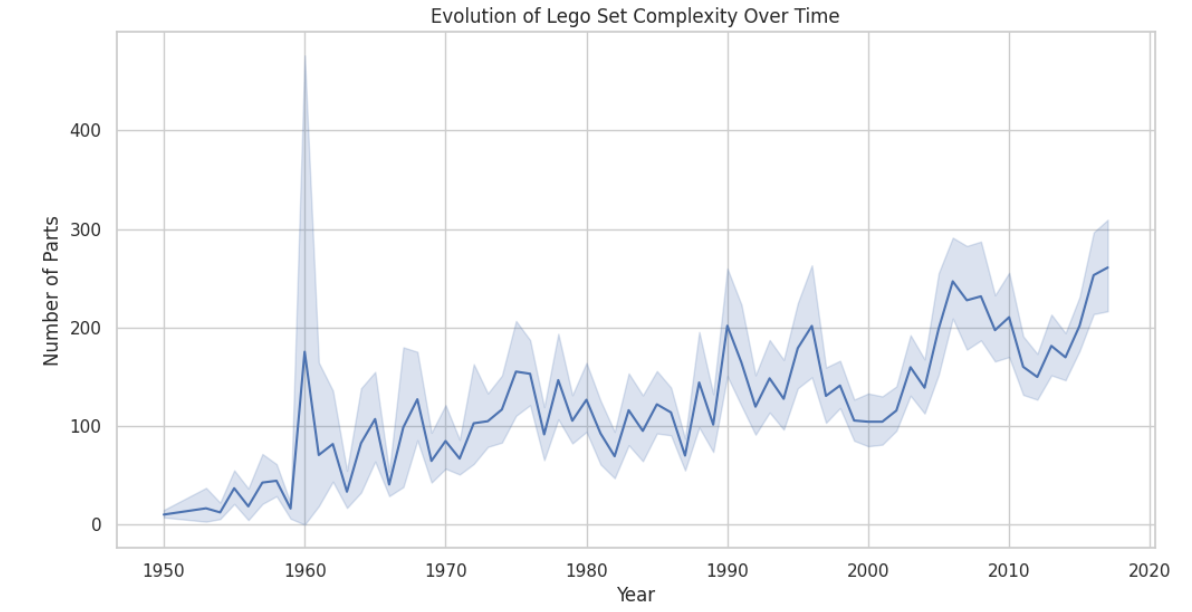
Description: Analyzing the summary statistics of the Lego sets over time, the mean values for the average number of parts in Lego sets for each year suggests a general trend of increasing complexity. This trend is particularly noticeable in more recent years, indicating a shift towards more intricate and elaborate Lego sets. The standard deviation values offer insights into the variability or dispersion in set complexity. Higher standard deviations in certain years suggest a broader range of complexity, showcasing the diverse nature of Lego sets within those periods. This variability may be influenced by factors such as changes in design techniques, manufacturing capabilities, and evolving consumer preferences. Examining the minimum and maximum values for each year reveals the range of set complexity. By identifying specific years with notable increases or decreases in complexity, one can discern potential periods of innovation or shifts in Lego set design philosophy. The percentiles (25%, 50%, 75%) provide further granularity, offering insights into the distribution of set complexity. The median (50%) indicates the middle value, while the interquartile range (IQR) between the 25th and 75th percentiles illustrates the spread of the central portion of the data. It’s important to consider certain anomalies, such as the presence of negative values in certain years (e.g., 1967), which may signify errors or missing data. Addressing such anomalies is crucial for ensuring the accuracy of the analysis. In summary, the statistics suggest an overall trend of increasing Lego set complexity over the years, with variations that reflect the dynamic nature of Lego design and production.
Author: Sangjun Ko - University of Illinois
LEGO Themes: From Generic to Franchise
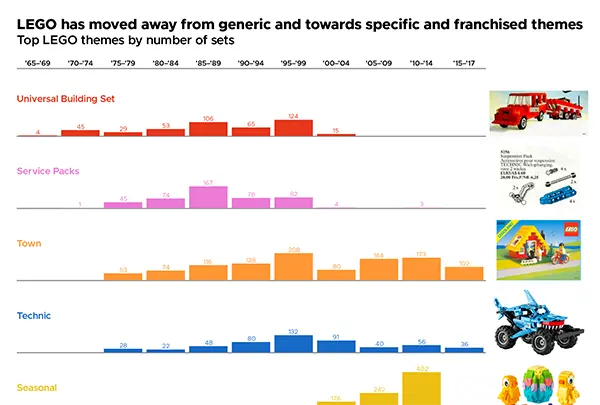
Description: These are the top LEGO themes by the number of sets developed for each theme over time. This data visualization shows that LEGO has moved away from generic themes such as "Universal Building Sets" and "Town" and towards specific and franchised themes, like "Star Wars" and collectible minifigures of popular characters like Elsa from Frozen.
Author: Elsie Lee-Robbins, PhD Student in the School of Information - University of Michigan
LEGO-Evolution and trends of creativity
Description: Evaluation of the evolution of LEGO data sets.
Author: Prajakta Godbole - University of Wisconsin-Madison
Lego Bricks Analysis
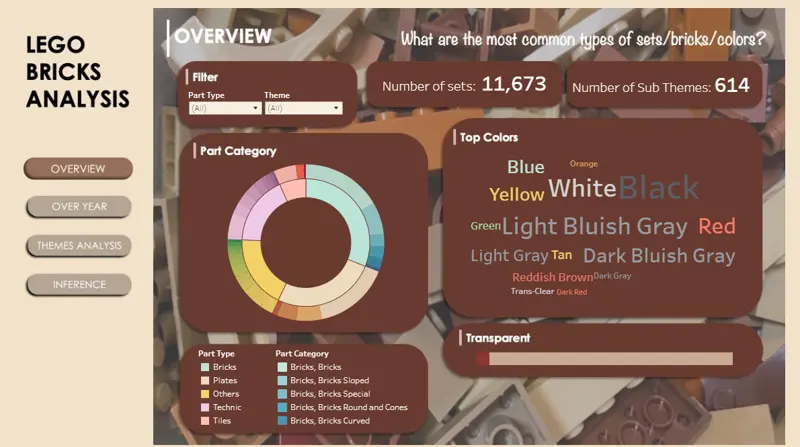
Description: This data visualization analyzes Lego Brick Data from 1950s to 2010s to address 4 big questions: Most Common Types (Overview), Evolution over Time (Over Year), Theme Overlaps and Differences (Themes Analysis), Inference about Target Audience (Inference)
Author: Khanh Chi Le - University of Minnesota
Building LEGO Piece-by-Piece: 1950-2017
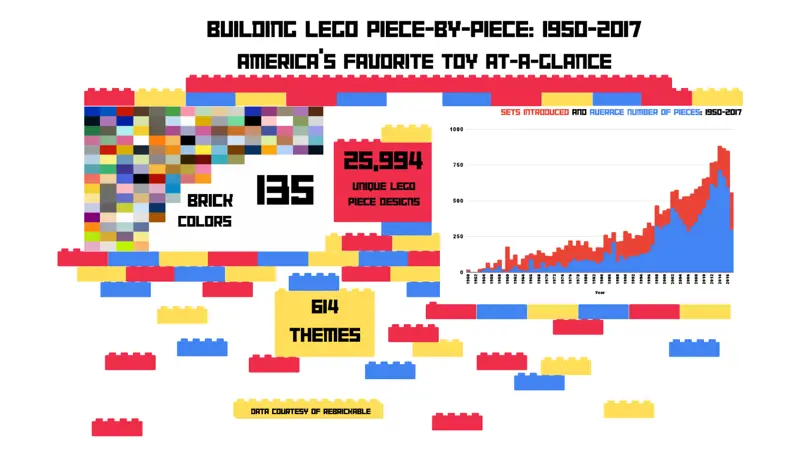
Description: An overview of some key values relating to Lego's increase in popularity over 60 years, including a display of the full range of Lego piece colors and a visual of the growth of Lego's yearly release of sets, and the complexity (average number of pieces) of the sets.
Author: Lily Barrett - Michigan State University
Staff Contact
Lori Frost
Program Manager
Programs Team
Phone: (217) 333-9228
Email: info@btaa.org
Institutional Coordinators
Illinois – Amy Edwards (aledward@illinois.edu)
Indiana – Bridgett Milner (bharsh@indiana.edu)
Iowa– Matthew Anson (matthew-anson@uiowa.edu)
Maryland – Michelle Appel (mappel@umd.edu)
Michigan – Tracy Pattok (tpattok@umich.edu)
Michigan State – Bethan Cantwell (cantwelb@msu.edu)
Minnesota – Colin Delong (delo0041@umn.edu)
Nebraska – Jason Casey (jcasey10@unl.edu)
Ohio State – Maureen Henry (henry.371@osu.edu)
Penn State – Paulina Krys (pmk5516@psu.edu)
Purdue – Andrea Pluckebaum (apluckeb@purdue.edu)
Rutgers - Eduardo Molina (e.molina@irap.rutgers.edu)
Wisconsin– Beth Helmueller-Perkins (helmuellerpe@wisc.edu)